Settings
The M Chart settings page is located at Chart → Settings in the WordPress admin.
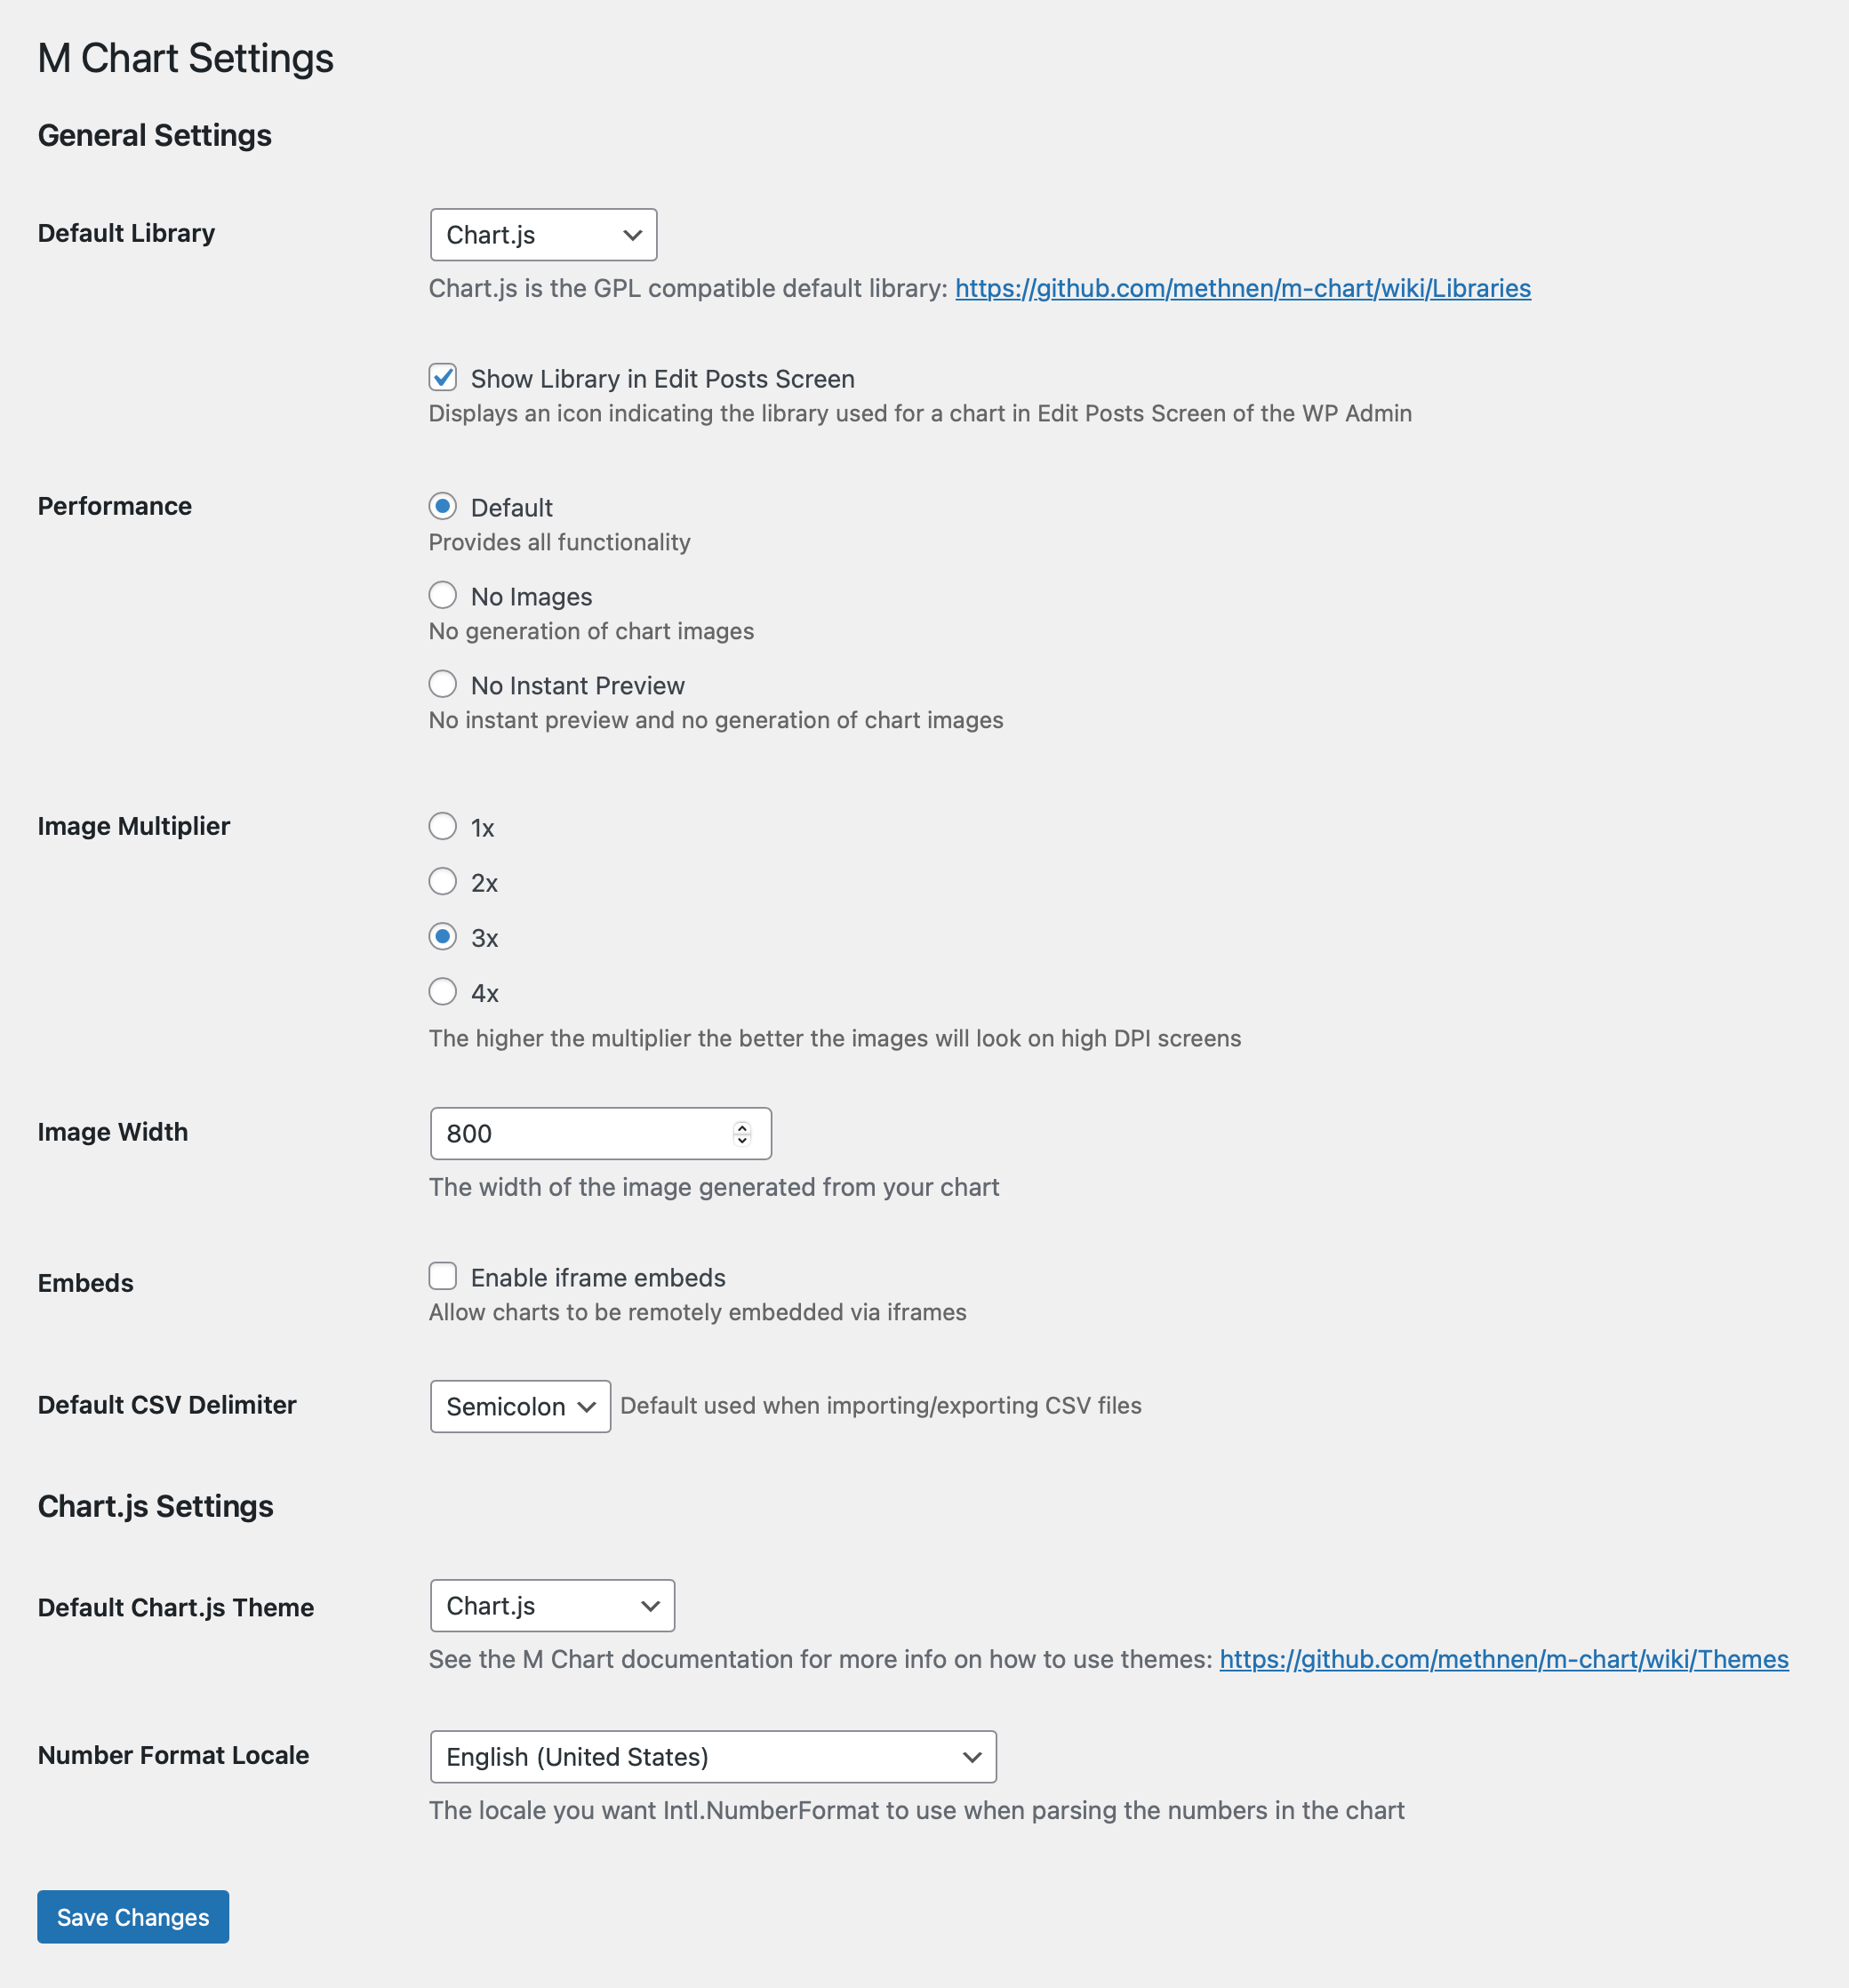
General
Library
Select the active charting library. Chart.js is the default. Highcharts is available if the M Chart Highcharts Library plugin is installed.
Show Library in Edit Posts Screen
A checkbox that adds an extra column to the Charts admin list, showing which library each chart was rendered with. Useful when your site mixes Chart.js and Highcharts charts and you want to spot the difference at a glance. Off by default.
Performance
A performance setting that allows you to either turn off image generation or additionally turn off instant previews.
Warning
Both of the non Default options disable image generation which is required for the show="image" shortcode option and for the automatic image fallback in RSS/AMP contexts.
Image Multiplier
Controls the pixel density multiplier used when generating chart images. Higher values produce sharper images on high-DPI screens at the cost of larger file sizes. Default is 2.
Image Width
The base pixel width of the PNG image M Chart generates from each chart. The image is the one used by the show="image" shortcode option and as the automatic fallback in RSS and AMP contexts. Default is 900.
Tips
Image Width has no effect when Performance is set to No Images or No Instant Preview — those modes turn off image generation entirely.
Default Chart Height
The starting height, in pixels, for new charts. Default is 400, and the value is clamped to the range 300–1500 on save.
Tips
This applies to new charts only. Existing charts keep their own height, so changing this does not retroactively alter charts you've already created.
Embeds
Enables the Enable iframe embeds checkbox. When checked, charts can be embedded via an iframe — needed for the share shortcode option, and helpful in some WordPress themes that don't otherwise render charts reliably.
Defer Rendering
A checkbox labeled Defer chart rendering until scrolled into view. When enabled, charts that load below the fold do not initialize (or play their entry animation) until the visitor scrolls them into view.
Default is on
This setting defaults to enabled, so existing sites updating the plugin will see the new behavior turn on automatically. If your charts rely on rendering immediately on page load — for example, to be picked up by synchronous screenshot tooling — uncheck this.
Chart.js
These settings apply only when Chart.js is the active library.
Theme
The default color theme applied to all charts. Individual charts can override this setting. See Themes for available options and how to create custom themes.
Number Format Locale
The locale used for number formatting in chart tooltips (e.g. en-US, de-DE, fr-FR). Controls decimal separators and thousands grouping. Defaults to en-US.
CSV
Default Delimiter
The delimiter used when importing CSV files. Defaults to comma (,). Can be overridden per-import on the chart edit screen.
Highcharts
These settings appear only when Highcharts is the active library. See the Highcharts section for details.