Multiple Sheets
Certain chart types support multiple sheets of data. Each sheet becomes a separate dataset (series) in the rendered chart, with the sheet name used as the series label in the legend.
Supported Chart Types
Multiple sheets are only available for chart types that inherently support multiple series with independent axes or dimensions:
- Scatter
- Bubble
- Radar
- Radar Area
- Boxplot
- Violin
For all other chart types (line, bar, pie, etc.) the spreadsheet shows a single sheet, and series are defined by rows or columns within that sheet.
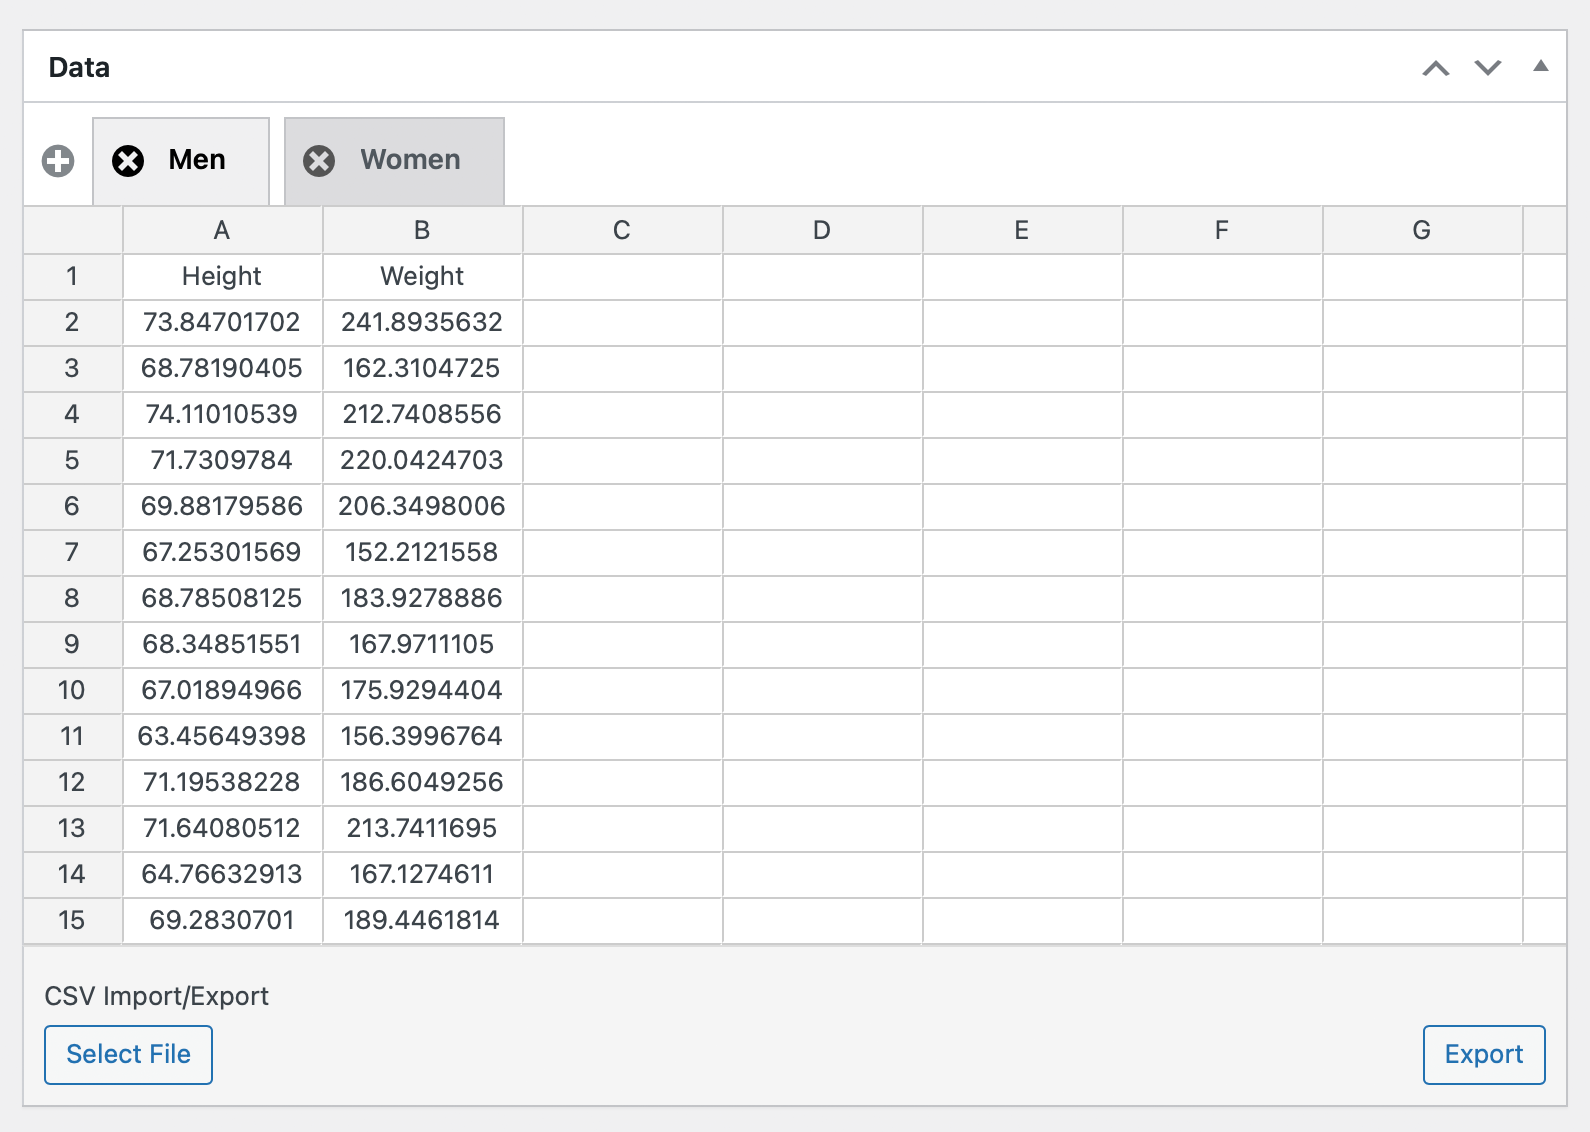
Managing Sheets
The sheet tab bar appears above the spreadsheet for supported chart types.
Adding a Sheet
Click the + button at the left end of the tab bar to add a new sheet. The new sheet tab immediately enters rename mode so you can give it a name right away.
Switching Sheets
Click any tab to make that sheet active. Only one sheet is visible at a time.
Renaming a Sheet
Double-click a tab (or long-press on touch devices) to enter rename mode. The tab text becomes editable — type a new name and press Enter or click elsewhere to confirm.
Sheet names are used as the dataset label in the chart legend.
Deleting a Sheet
Click the × icon on a tab to delete that sheet. You will be asked to confirm before the sheet and its data are removed. The last remaining sheet cannot be deleted.
How Sheets Map to Chart Data
Each sheet is parsed independently. When the chart renders:
- Each sheet produces one dataset
- The sheet name becomes the dataset's legend label
- Radar and Radar Area: all sheets share the same set of category labels (from the first sheet's label column/row)
- Scatter and Bubble: each sheet's data is plotted independently — there are no shared categorical labels; each sheet provides its own x/y (and radius) values
- Boxplot and Violin: all sheets share the same set of category labels (from the first sheet's label column/row); each sheet contributes a parallel box or violin per category