
Annotations
Annotations overlay marks on a chart — a horizontal threshold line, a shaded box highlighting a date range, a callout label tied to a specific point — without altering the underlying data. Annotations are a Chart.js-only feature.
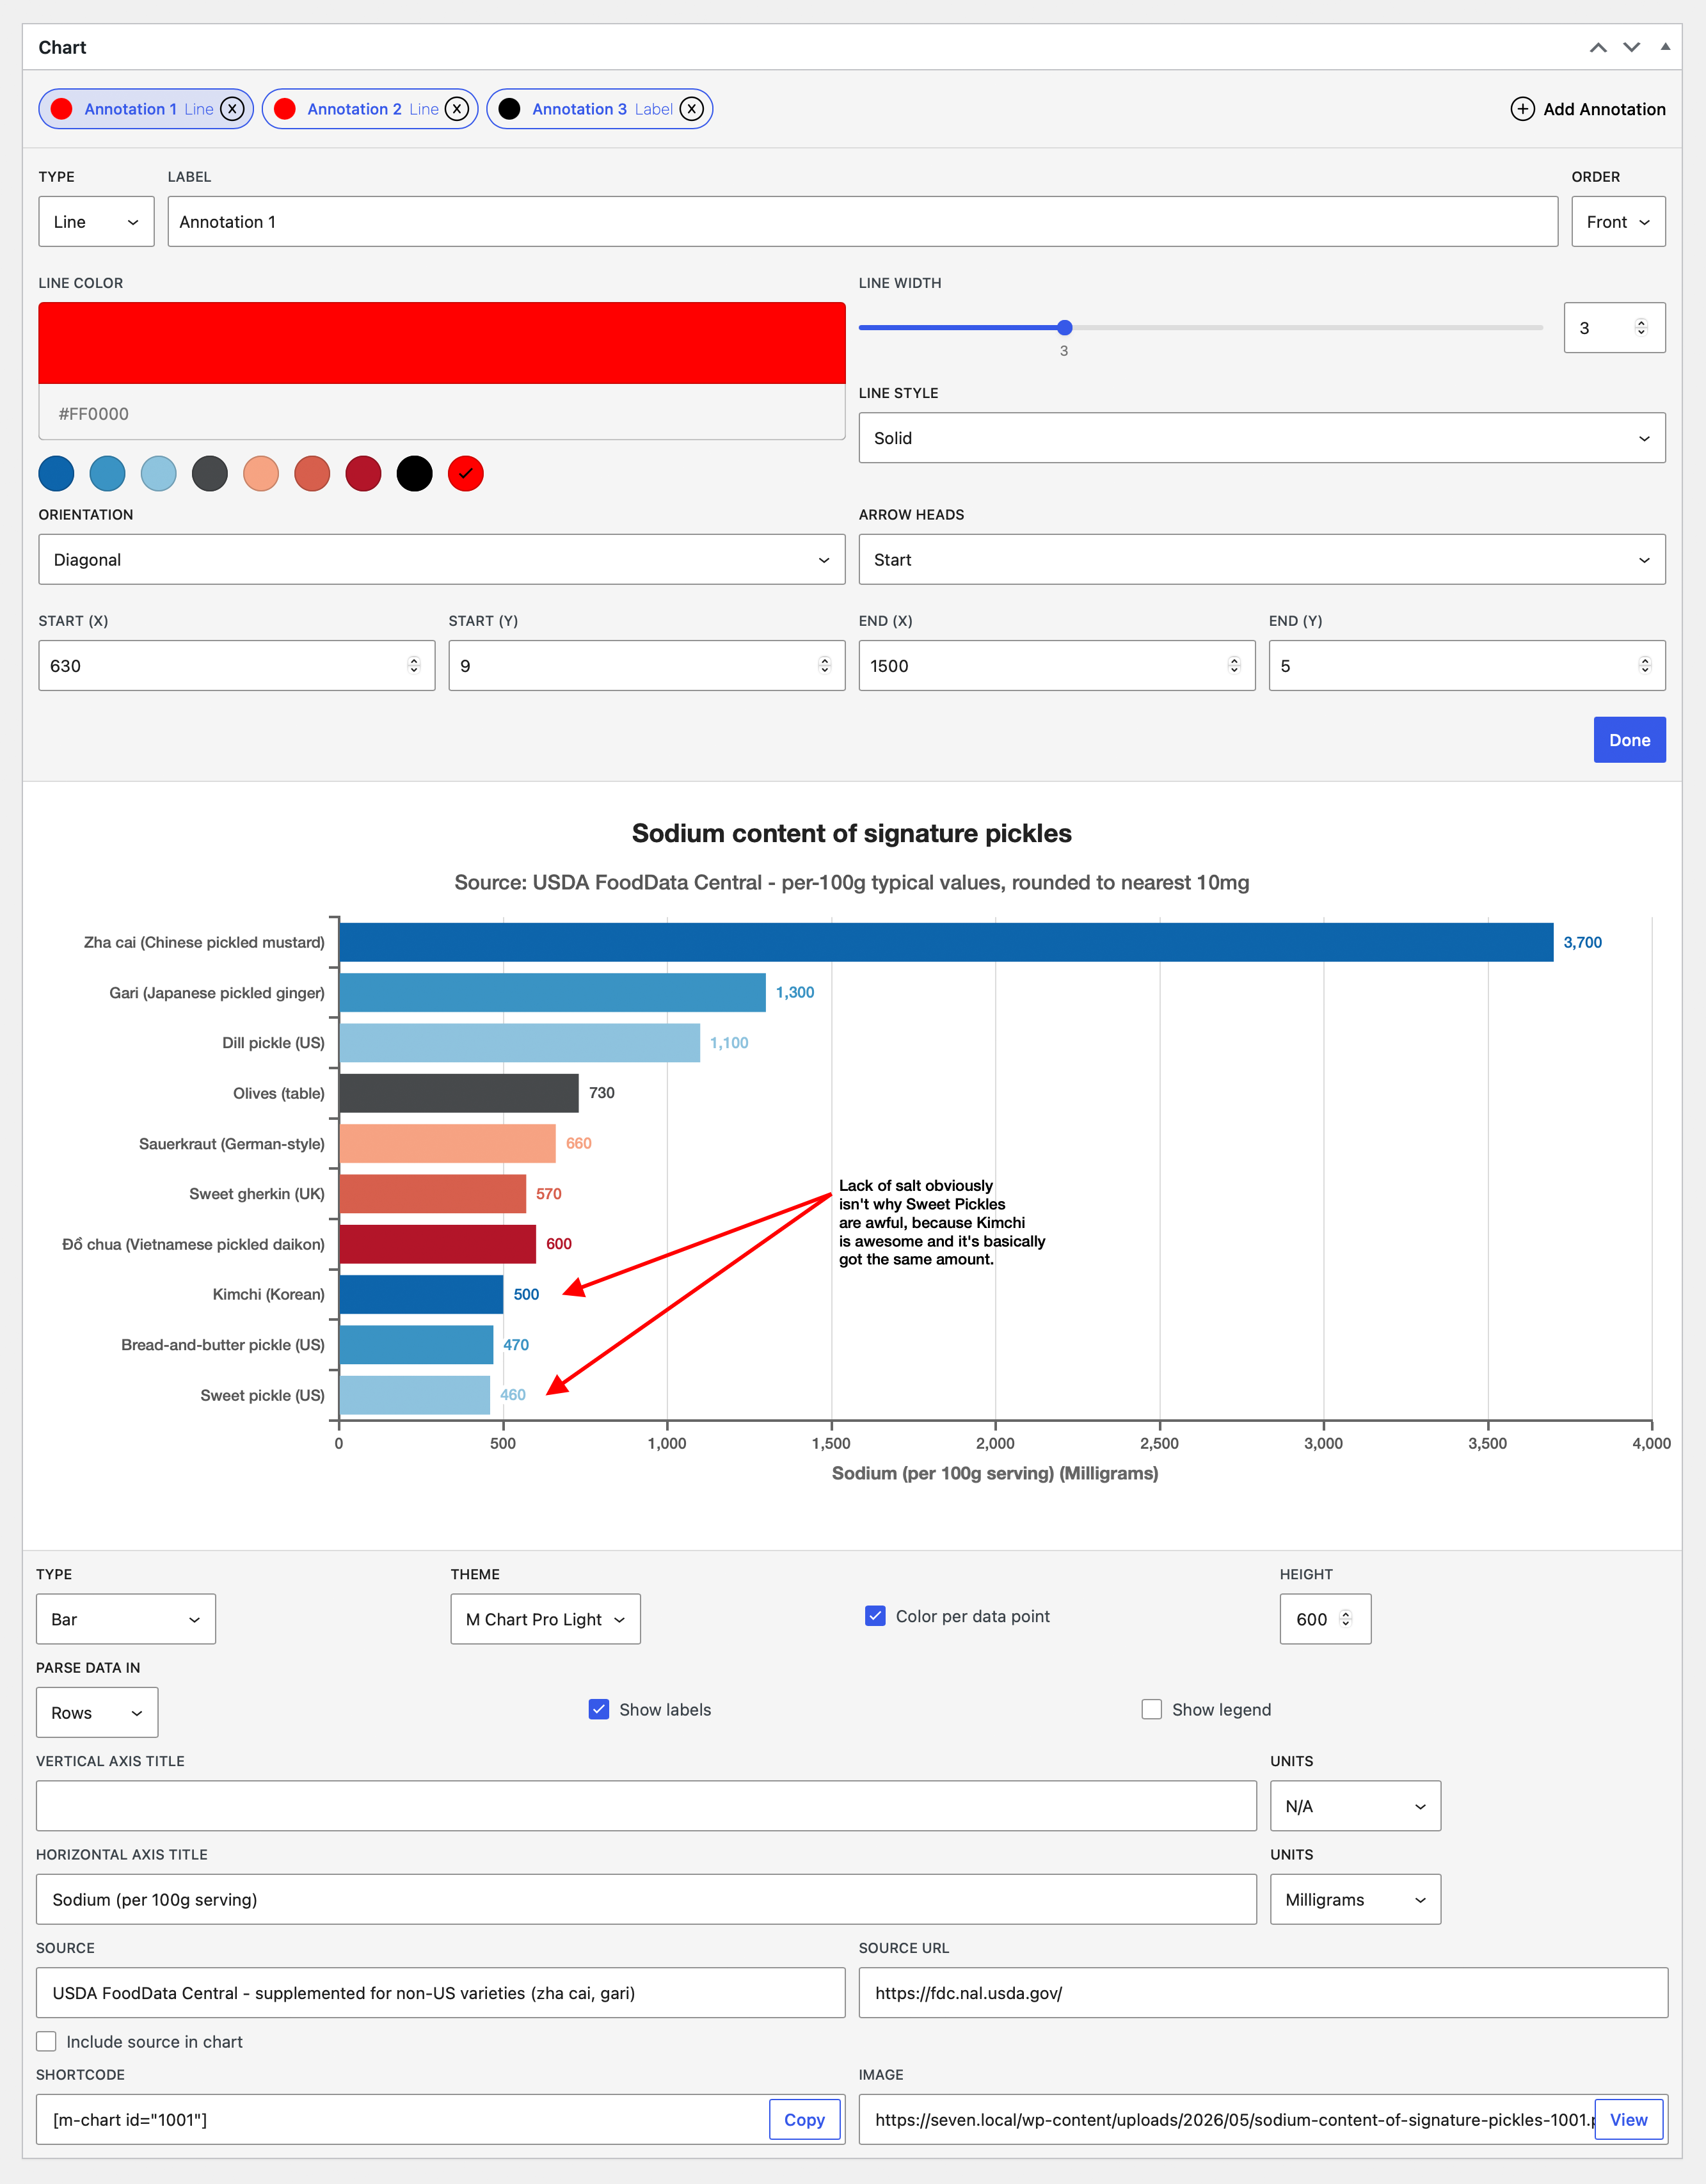
Chart.js only
The Annotations panel only appears on charts whose library is set to Chart.js. On Highcharts charts the panel is hidden. If you don't see it, switch the chart's library on the Libraries page.
Adding your first annotation
The Annotations panel lives inside the existing Chart meta box on the chart edit screen, directly above the chart preview. It is not a separate meta box and not a tab.
When a chart has no annotations yet, you'll see a single Add Annotation button. Click it and a new annotation appears in the list, seeded with sensible defaults, with the editor open below it ready for changes. On Cartesian charts (bar, line, scatter, etc.) the default is a Line; on radial charts (pie, radar, polar, etc.) and on venn and euler charts it's a Point (on venn and euler it arrives already targeting the diagram's first region); on treemap charts it's a Box.
Annotation types
Pick a type from the Type dropdown. Six types are available:
| Type | What it draws | Positional inputs |
|---|---|---|
Line | A straight line across the chart | Orientation (Horizontal / Vertical / Diagonal). Horizontal needs Position (Y), vertical needs Position (X), diagonal needs Start (X), Start (Y), End (X), End (Y). Also has Arrow Heads: None, Start, End, Both. |
Box | A filled rectangle spanning a range on both axes | X Min, X Max, Y Min, Y Max. |
Label | Free-floating text on the chart | Position (X), Position (Y). Multi-line via newlines in the Content textarea. |
Ellipse | An ellipse fitted to a bounding box | X Min, X Max, Y Min, Y Max. |
Point | A marker at a single coordinate | Position (X), Position (Y). Pick from 10 marker shapes: Circle, Plus, Line, X, Dash, Square, Rounded Square, Diamond, Asterisk, Triangle. |
Polygon | A regular polygon around a center point | Position (X), Position (Y), plus Sides (3–12), Radius, and Rotation. |
Not every type is available on every chart. On radial charts (pie, doughnut, radar, radar area, polar) the Type dropdown is limited to Line, Label, Point, and Polygon. On treemap charts it offers Box, Label, and Point. On venn and euler charts it offers Label and Point only. See Supported chart types for the reasoning.
The "Positional inputs" column above describes Cartesian charts. Radial, treemap, and venn/euler charts replace those inputs entirely with their own positioning controls; see Positioning.
Common settings
Every annotation type shares the same top row and styling controls:
Label— an editor-only nickname shown in the annotation list. It is not rendered on the chart. Use it to find the annotation in the list. Defaults toAnnotation 1,Annotation 2, and so on.Type— switches the annotation between the six types listed above. Position values are partially preserved when you switch.Order—Frontdraws the annotation on top of the chart data;Backdraws it behind. Default isBack.Line Color/Border Color— color picker. Choices come from the active chart theme's palette plus black and red. Opacity is supported. The label readsLine Colorfor line annotations andBorder Colorfor everything else.Line Width/Border Width— slider 0–10, with a tick mark at the chart's default line width.Line Style/Border Style—Solid,Dashed, orDotted.Border Radius— slider 0–25. Shown forBoxandLabelonly.Background Color— color picker. Shown for every type exceptLine. Defaults to a 50%-opacity tint of the border color.
Label content (Label type only)
When the type is Label, additional fields appear:
Content— multi-line textarea. Each newline becomes a new line in the rendered label.Padding— slider 0–30.Text Align—Left,Center, orRight. Also drives the label's anchor.Rotation— slider –180° to 180°.Text Color— color picker.Font Size— 11–40 px.Line Height— 1.0–2.0.Style—NormalorItalic.Weight—NormalorBold.
Positioning
How you position an annotation depends on the chart's coordinate system. There are four systems: Cartesian, radial, treemap, and venn/euler.
On Cartesian charts
Positions are entered as numeric axis values in chart coordinates, not pixel offsets and not category names.
- On a numeric axis (a typical Y-axis with values, or a scatter chart's X-axis), type the number you want.
- On a category axis (a text X-axis with values like month names), you must type the numeric index of the category. The first column is
0, the second is1, and so on.
There is no category-name picker.
Example
If your chart's X-axis shows Jan, Feb, Mar, Apr, then March is 2.
Because positions are stored as raw numbers, an annotation does not "follow" a renamed category: index 2 is still index 2. If you later change the underlying data so that an index falls outside the new category range, Chart.js will draw the annotation at the chart boundary; it won't error out, and it won't auto-delete.
On radial charts
Radial chart types (pie, doughnut, radar, radar area, polar) don't have X and Y axes. Position inputs change to a polar pair instead:
Distance from Center— slider from0%(the center of the chart) to150%of the chart's outer radius.100%sits exactly on the outer edge. Anything above100%extends past the plot area, which is useful for callouts; the chart auto-pads its layout to keep those annotations visible.Angle (°)— slider from0°to360°.0°points straight up (12 o'clock) and angles increase clockwise —90°is to the right,180°is straight down,270°is to the left.
Lines on radial charts are drawn between two polar points: a Start Distance / Start Angle pair and an End Distance / End Angle pair. There's no Horizontal / Vertical / Diagonal orientation control on radial charts.
On treemap charts
Treemap charts have no axes; annotations attach to the treemap's own rectangles instead. A Targets multi-select lists every group and leaf in the chart's data as a path — A > B > C — where a shorter path targets a group's rectangle and a full path targets a single cell. One annotation can target several rectangles at once and is drawn once per rectangle.
A Position grid picks where on each target rectangle the annotation anchors: one of the four corners, the four edge midpoints, or the center. Horizontal Offset and Vertical Offset nudge it from there, in pixels or in percent of the target cell's own width and height (the Units toggle).
This applies to all three types available on treemaps: Box, Label, and Point. On a chart with no treemap data yet, the panel says "Switch to a treemap chart with data to pick target rectangles."
On venn and euler charts
Venn and euler charts position annotations by region, not by coordinates. The Targets multi-select lists the diagram's own regions: a set name on its own means that set's exclusive region (the part belonging to no other set), and intersections appear joined with " ∩ " — Email ∩ Social — with the order of the names not mattering. One annotation can target several regions and is drawn once per region, anchored at each region's own label point, so it follows the diagram's layout at any size.
Optional Horizontal Offset and Vertical Offset fields nudge the annotation from the region's anchor, in pixels (up to ±200) or percent of the chart area (up to ±100), via the Units toggle.
Switching an annotation between Label and Point keeps its targets and offsets. An annotation can target up to 50 regions, and a region can involve up to 5 set names. On a chart with no venn data yet, the panel says "Switch to a venn or euler chart with data to pick target regions."
Venn and euler charts — and therefore these annotations — require M Chart core 2.3 or later.
When targets disappear
On treemap and venn/euler charts, targets live in the chart's data. If the data changes so a target no longer exists, the editor shows a warning ("Some targets no longer exist in the chart's data and won't render until you remove or re-pick them"), and the missing targets are simply skipped at render. Like a Cartesian annotation whose index falls out of range, nothing errors out and nothing is auto-deleted.
Editing existing annotations
You can open an annotation's editor in two ways:
- Click the annotation in the list, or
- Click the annotation directly in the live chart preview.
Either way, the editor opens and the meta box scrolls into view. The Done button at the bottom of the editor closes it and scrolls back to the chart. Done does not save independently; saving happens when you save or update the post.
Reordering annotations
Drag any row in the annotation list to a new position to change its order. Drop the row where you want it. The list highlights the drop target while you drag.
Removing annotations
Each row in the annotation list has an X icon. Clicking it opens a Delete Annotation confirmation modal with Delete and Cancel buttons.
Live preview
The chart updates immediately as you add, edit, or remove annotations. Slider drags are debounced about a fifth of a second; everything else is instant. There's no refresh step.
Saving
Annotations are saved with the post when you click Update or Publish. There is no separate save button inside the panel.
Supported chart types
Every Chart.js chart type that M Chart Pro supports can carry annotations. Which annotation types are available depends on the chart's coordinate system:
- Cartesian charts —
Bar,Column,Line,Area,Scatter, andBubble— support all six annotation types (Line, Box, Label, Ellipse, Point, Polygon). - Radial charts —
Pie,Doughnut,Radar,Radar Area, andPolar— supportLine,Label,Point, andPolygononly.BoxandEllipseneed an X/Y axis pair to position against, so they aren't offered there. - Treemap charts — support
Box,Label, andPoint, positioned against the treemap's own rectangles (see On treemap charts). - Venn and euler charts — support
LabelandPointonly, positioned by region (see On venn and euler charts). There's noBoxhere because the lens-shaped regions of a venn diagram have no meaningful rectangular bounds to span. Requires M Chart core 2.3 or later.
Every chart type supports at least the Label and Point annotation types.
Limits and gotchas
- A chart can have at most 50 annotations. Anything beyond that is silently dropped when the post is saved.
- There is no way to duplicate or bulk-delete annotations.
- The
Labelfield on each annotation is for your reference in the list only; it is not drawn on the chart. To put text on the chart, use theLabelannotation type. - Annotations are not included in CSV export and cannot be added via CSV import.
- Annotations are tied to their chart's coordinate system: Cartesian, radial, treemap, or venn/euler. Switching the chart to a type in a different system hides the mismatched annotations from the list, and a notice appears ("1 annotation was made for a different chart type and won't render here."). The
Add Annotationbutton is disabled until you either switch the chart type back, or clickDelete Mismatchedin the notice to remove them. - On treemap and venn/euler charts, targets that disappear from the data are skipped at render, with a warning in the editor; see When targets disappear.
- Duplicating a chart with a third-party post-duplicator tool will carry annotations along.