
Display as Table
Display as Table publishes a chart's data as an interactive table in place of the chart. The Display as Table toggle sits on the top edge of the Chart meta box. The table is built with the DataTables library. The chart's own settings are kept while the table is on. Developer notes for tables are in M Chart Pro for developers.
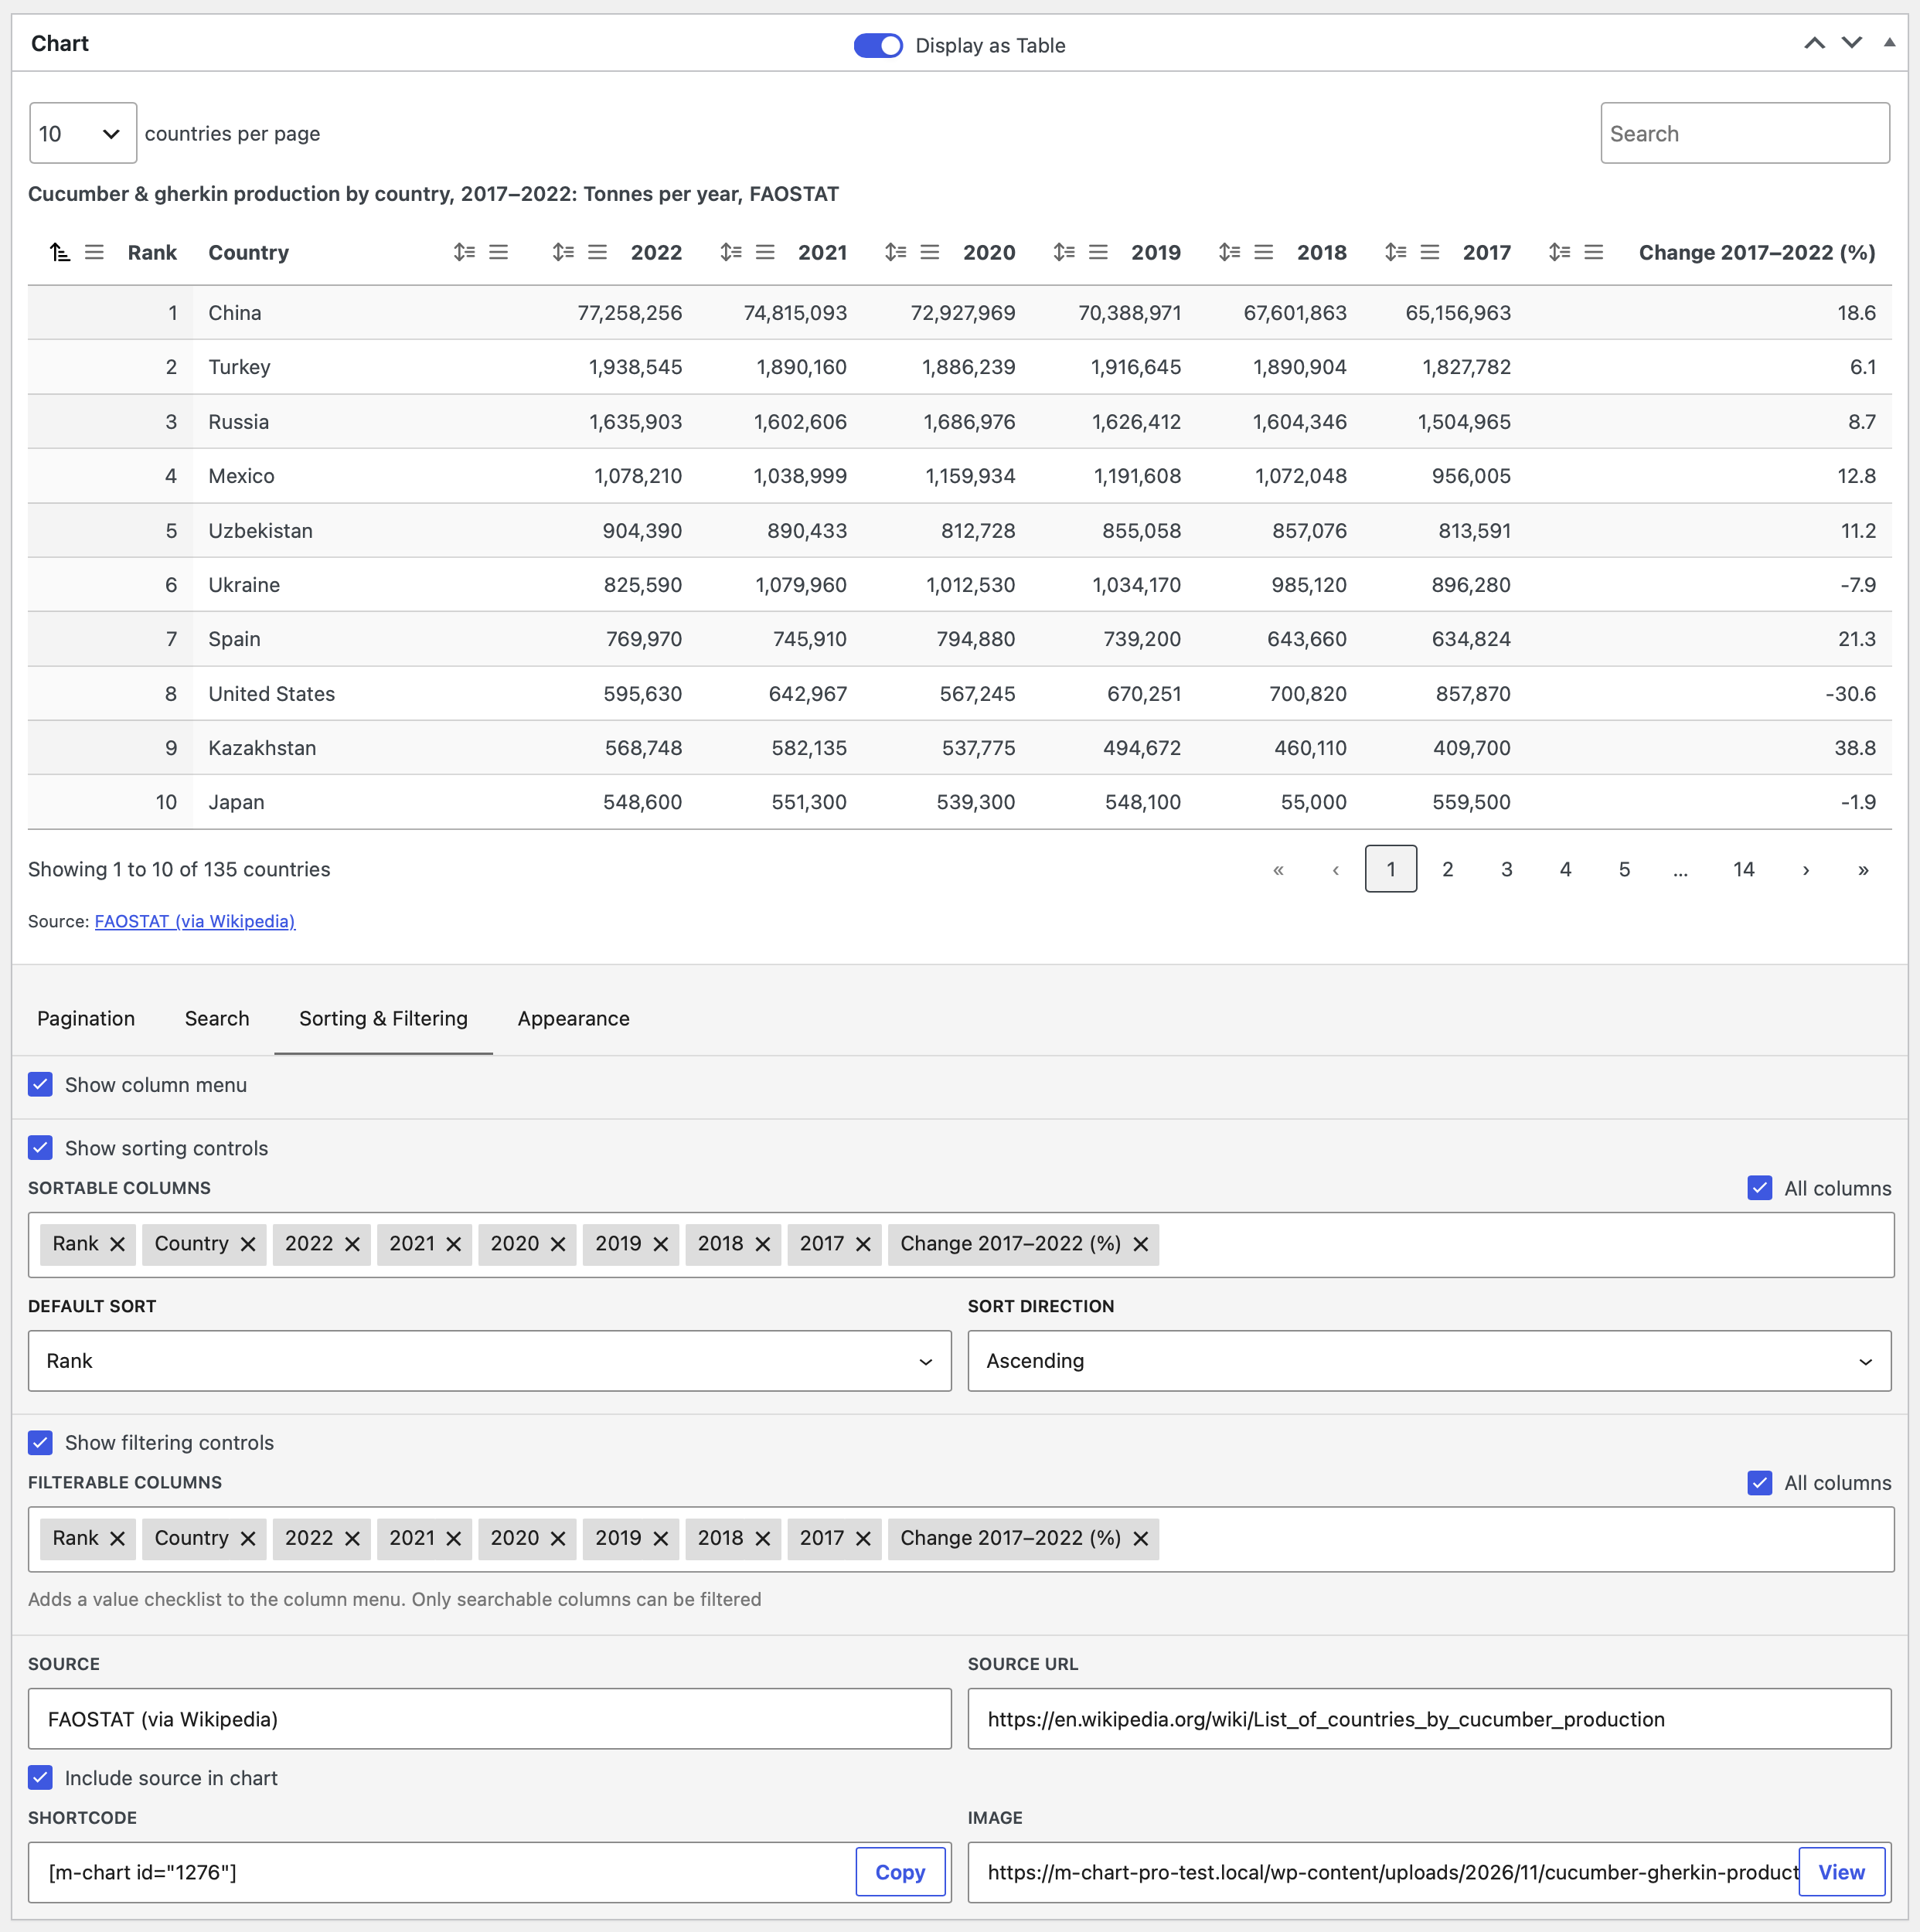
Chart.js only
The toggle only appears on charts whose library is set to Chart.js. Highcharts charts have no toggle. If you don't see it, check the chart's library on the Libraries page. Requires M Chart Pro 1.2 and M Chart 2.4 or later.
Turning it on
Turn on the Display as Table toggle. The live preview replaces the chart with the table. The chart settings below the preview are replaced by four tabs of table settings. Source, Source URL, Shortcode, Image, and Include source in chart stay where they were.
The Annotations panel and the sheet tabs are hidden while the table is on. The preview never shows the sticky header. In the Charts list, the Type column reads Table with a table icon instead of the chart type.
How the sheet becomes a table
Fully empty rows are dropped. Empty columns inside the used range are kept, so each cell stays in its own column.
You tell M Chart which line of the sheet is a header; it does not guess. Two checkboxes on the Appearance tab, First row is a header and First column is a header, control this:
First row is a header | First column is a header | Result |
|---|---|---|
| On (default) | Off (default) | The first row becomes the column headers. |
| On | On | The first row becomes the column headers, the first column becomes row headers, and the top-left cell is the header over the row headers. |
| Off | On | The first column becomes row headers. Column headers are generated as Column 1, Column 2, and so on. |
| Off | Off | Every row is data. Column headers are generated. A sheet with a single data column gets the header Value. |
The chart's Parse data in setting has no effect on the table.
Smart Data Selection applies to the table as well. Rows and columns you exclude by hand stay out of the table. In Auto mode the header checkboxes replace its own estimate of the sheet's shape. The top-left cell is never treated as empty, and text rows with two or more cells are kept.
Numbers and text
Cells are read the same way as for a chart. A prefix or suffix such as $ or % comes from the cell text itself, not from the chart's Units setting. Numbers are formatted with the Number Format Locale setting. Searching and sorting read numbers with the same decimal separator.
A column sorts by value only when every filled cell in it is a number. A column with one text cell sorts as text. A cell made of several numbers, such as a date, a version number, or a phone number, is treated as text and shown as typed.
Caption and source
The table's caption is the chart title, followed by : and the subtitle when there is one. A chart with no title gets a caption of Table that only screen readers see.
When Include source in chart is on and Source is filled in, a Source: line appears under the table summary. When the summary is off, the line takes its place. It links to Source URL when one is set. Without JavaScript the line prints after the table.
Table settings
The settings sit in four tabs: Pagination, Search, Sorting & Filtering, and Appearance. Several settings ask you to pick columns. Each column picker except Always visible columns has an All columns checkbox above a field where you pick columns one at a time. Only columns that contain data are offered. A column with a blank header appears as Column 2 and so on, or as Row headers for the column that holds row headers. Repeated header names get (2), (3), and so on, so each column can be told apart.
Pagination
Show pagination— splits the rows into pages with page buttons under the table. Default is on.Show table summary— shows a line such as "Showing 1 to 10 of 42 rows" under the table. Default is on.Rows per page—10,25,50,100, orAll. Default is10. ChoosingAllturnsShow paginationoff.Show rows per page menu— lets the reader change the rows per page. Default is on.Row name (singular)/Row name (plural)— the words used in the summary and the rows per page menu, for examplecountryandcountries. Up to 40 characters each. Default isrowandrows.
Rows per page and Show rows per page menu are disabled while Show pagination is off.
Search
Show search field— shows a search box above the table. Default is on.Searchable columns— the columns the search box looks in. Disabled whileShow search fieldis off. Default is all columns.
Sorting & Filtering
Show column menu— adds a menu button to every column header. The menu holdsSort ascending,Sort descending, andClear sort, plus aFilterchecklist of the column's values on filterable columns. Default is off.Show sorting controls— adds a sort button to each sortable column header. Default is on.Sortable columns— the columns that can be sorted. Default is all columns.Default sort— the column the table is sorted by when it loads. Only sortable columns are offered.Sheet orderleaves the rows as they are in the sheet. Default isSheet order.Sort direction—AscendingorDescending. Disabled until aDefault sortcolumn is picked. Default isAscending.Show filtering controls— adds theFilterchecklist to the column menu. NeedsShow column menuon. Default is off.Filterable columns— the columns that get a checklist. Only searchable columns are offered. Default is all columns.
Hiding the search field does not disable filters. If sorting and filtering are both off, the column menu is empty.
Sortable columns, Default sort, and Sort direction are disabled while Show sorting controls is off. Filterable columns is disabled unless both Show column menu and Show filtering controls are on. Removing the Default sort column from Sortable columns resets Default sort to Sheet order. A saved sort column that is no longer in the sheet shows as Column no longer exists.
Appearance
Color scheme—Inherit from pageuses your theme's colors.LightandDarkuse a fixed light or dark palette.Auto (match visitor's OS)follows the visitor's light or dark setting. Default isInherit from page.Borders—Rowsdraws a line between rows,Cellsdraws a line around every cell,Nonedraws no lines. Default isRows.
Structure
Compact table— reduces the padding in every cell. Default is off.First row is a header— see How the sheet becomes a table. Default is on.First column is a header— see above. Default is off.Show zebra stripes— shades every other row. Default is on.
Cells
Highlight row on hover— shades the row under the pointer. Default is on.Highlight sorted column— shades the column the table is sorted by. Default is off.Prevent text wrapping— keeps each cell on one line. Default is off.
Sizing & Scrolling
Responsive— on narrow screens, columns that don't fit collapse into a row the reader can expand. Default is off.Horizontal scroll— a table wider than the space it has scrolls sideways. Default is off.Vertical scroll— the rows scroll inside the setHeight. Default is off.Sticky header— the header row stays visible while the page scrolls. Default is off.Always visible columns— columns that never collapse whenResponsiveis on. Default is none.Pinned columns— the number of columns, up to 3, that stay in place while the table scrolls sideways. At least one column always stays free to scroll. Default is0.Height— the scroll height in pixels, from 300 to 1500. Also the starting height of iframe embeds. See Height.
A line under these checkboxes spells out what is in effect, for example "Collapse columns into expandable rows on narrow screens and keep the header at the top of the window while the page scrolls (not shown in the preview)".
Some of these settings only apply in combination:
| Setting | Only applies when |
|---|---|
Horizontal scroll | Responsive is off |
Sticky header | Vertical scroll is off. Never shown in the preview. |
Always visible columns | Responsive is on |
Pinned columns | Horizontal scroll is on |
Height | Vertical scroll is on |
A setting that does not apply is shown disabled. Its value is kept and comes back when the conflict is removed.
Height
With Vertical scroll off, the table is as tall as its content. After each preview the editor measures the table and saves that measurement as the chart's height. The value is rounded up to the nearest 10 pixels and kept within the 300 to 1500 range that applies to chart heights. The Height field shows the measurement but can't be edited.
With Vertical scroll on, Height is editable. The whole table, including its controls, fits inside that height and the rows scroll within it.
In both cases the saved height is the starting height of iframe embeds. New charts start from the Default Chart Height setting.
Where the table appears
The [m-chart id="…"] shortcode and the M Chart block with Show set to Chart render the table. The shortcode's width attribute sets the table's maximum width.
Not the same as show="table"
The shortcode's show="table" value and the block's Table option are a core M Chart feature. They print a plain table of every sheet with no controls. Display as Table replaces the chart output itself and is reached with the default show value.
The image version
Show set to Image, RSS feeds, AMP pages, and the block editor's preview use the image M Chart saves with the chart. For a table, that image is captured from the live preview in the editor. It shows the current page of rows, after the current sort and search, with every column, the caption, and the headers. Pinned and collapsed columns are expanded for the capture. The Dark color scheme gives it a dark background. Auto is captured with the light palette.
The image is only captured when the Performance setting is Default. Its width comes from Image Width and its resolution from Image Multiplier.
Iframe embeds
When embeds are on, the iframe starts at the chart's saved height. On your own site the page then grows the iframe to fit the table. A share-code embed on another site stays at the saved height, and the table scrolls inside it.
Without JavaScript
The full table is in the page as plain HTML, with formatted numbers and the source line. Readers without JavaScript see every row with no controls. A table in the page ignores the Defer Rendering setting and loads with the page. An iframe embed is lazy-loaded when that setting is on, like a chart's.
Core settings that affect tables
Display as Table has no settings of its own on the Charts → Settings page and no license requirement. These core settings apply:
| Setting | Effect on tables |
|---|---|
Performance | The image version is only captured when set to Default. |
Image Multiplier | Resolution of the image version. |
Image Width | Width of the image version. |
Embeds | Enables iframe embeds, which grow to fit the table on your own site. |
Number Format Locale | Decimal and thousands separators in numeric cells, and how numbers are read for searching and sorting. |
Default Chart Height | Starting height for new charts, used until the table is first measured. |
See Settings for each one.
Chart settings while the table is on
These chart settings are kept but have no effect on the table: chart type, Parse data in, Units, the axis settings, the chart's theme including Theme Builder themes, and annotations.
External Data syncs update the saved data as usual. The table reflects a sync on the next page load. A table chart can also use another chart as its source, or be the source for other charts.
Turning the toggle off brings the chart back with the settings and height it had. The chart's height is stored when the toggle is turned on and put back when it is turned off.
Limits and gotchas
- Chart.js only. Highcharts charts have no toggle.
- The shortcode's
show="table"and the block'sTableoption are unrelated; they print a plain table of every sheet. - The image version shows the current page of rows only, and is only captured when
PerformanceisDefault. - Iframe embeds grow to fit the table on your own site only. On other sites they stay at the saved height and scroll.
- A prefix or suffix comes from the cell text, not from the Units setting.
- A column sorts by value only when every filled cell is a number.
- The sticky header never appears in the editor preview.
- A table in the page ignores the
Defer Renderingsetting. An iframe embed is lazy-loaded like a chart's. - Chart themes, Theme Builder themes, and annotations have no effect on the table.
- An External Data sync shows in the table on the next page load.
- Row names are limited to 40 characters. At most 3 columns can be pinned.